Table of Contents
Immigrants and Non-Permanent Residents: Who is actually in Alberta?1
On October 19th, 2026, Alberta will hold a non-binding referendum that includes four questions on immigrants and/or non-permanent residents (NPRs). One question asks whether the province should take greater control over immigration to reduce it. The other three propose new conditions on the access of NPRs to provincially-funded programs, including health care, education, and social supports.
Over the next few days, I am going to work through what the evidence says about those four questions, drawing on a report I have partnered with the Muttart Foundation to write.
These referendum questions were posed amidst growing concerns that increased immigration into Alberta was not being fully absorbed by the labour market and that “disastrous” federal immigration policies are creating an “unprecedented strain” on health-care, education and other social programs. And within the last few weeks, Premier Danielle Smith has taken to social media posting comments such as:
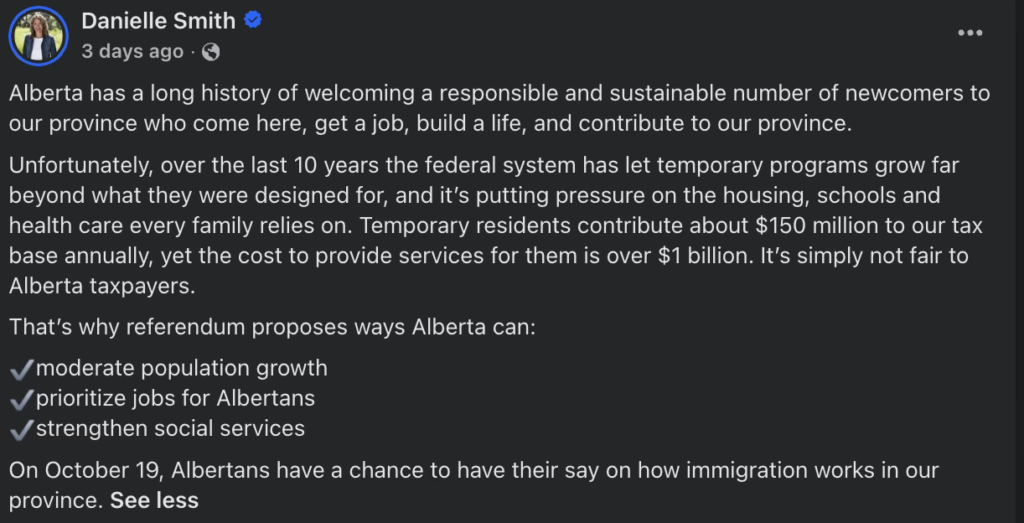
I want to come back to these concerns and numbers in later posts. But first, we have to know how many people we are talking about when we talk about immigrants and NPRs, what status they hold, and how quickly any of it has changed. Thus, I am starting with the question that sits underneath all of them, which is what these terms mean and who is actually here.
1 Note that numbers in this post are preliminary and subject to change.
Spoiler Alert
Here’s the punchline for anyone who doesn’t want to wait for it:
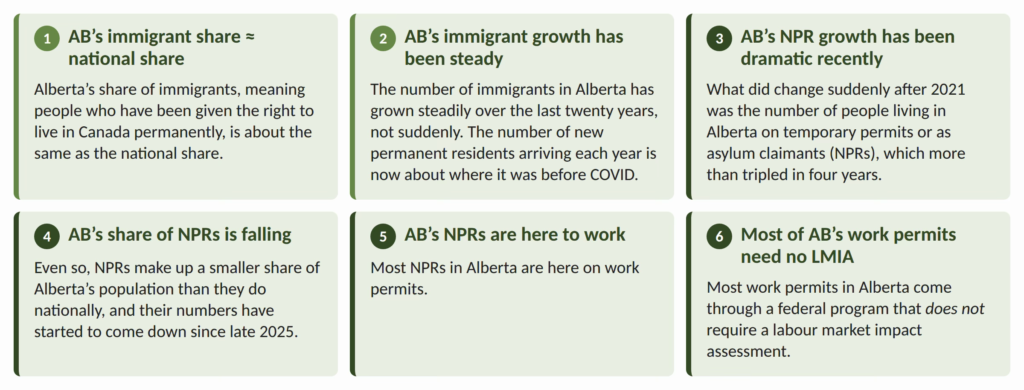
What is an “Immigrant”, “Non-Permanent Resident”, and “Temporary Worker”?
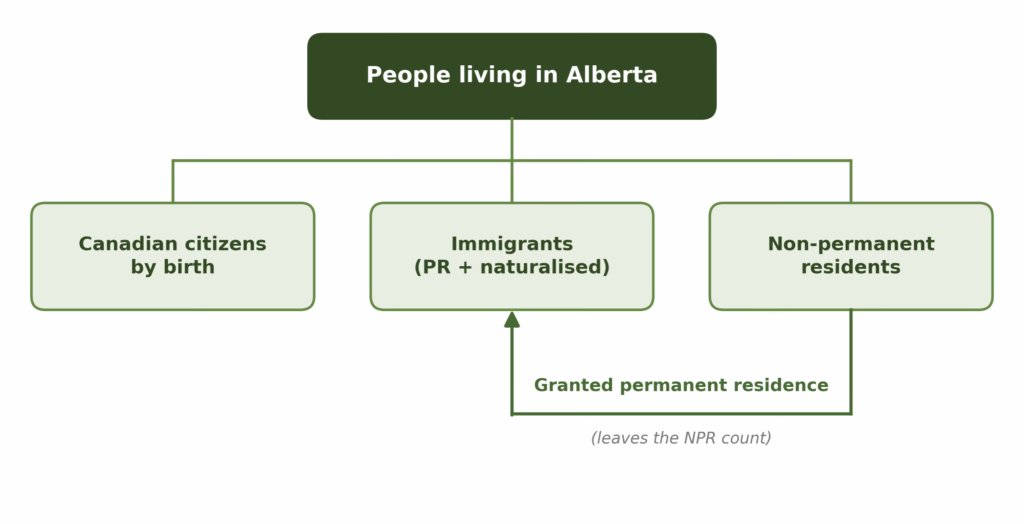
An immigrant is someone who has been granted the right to live in Canada permanently, whether or not they have since become a citizen. Immigrants include permanent residents or those with “PR” status, and Canadian citizens who were born citizens of another country, moved to Canada, and became a citizen here.
A non-permanent resident is someone here on a work or study permit, or someone who has claimed refugee status, along with family members living with them (unless those family members are immigrants or Canadian citizens by birth – then they are counted in their respective category). For those here on a permit, permits are temporary and expire. Permits may be renewed.
Nobody is in both groups at once: when an NPR is granted permanent residence they stop being counted as an NPR and start being counted as an immigrant.
NPRs are usually described by the kind of permit they hold. A temporary worker is an NPR who holds a work permit. NPRs here on a study permit are often called “international students”. A study permit authorizes them to remain in Canada for their studies, and it carries a limited entitlement to work. A student who wants to work beyond that limit, or who wants to stay and work after graduating, must apply for a work permit. Asylum claimants may hold a work permit, a study permit, both, or neither.
How many, and how Alberta compares
A natural first question is whether Alberta has more immigrants and NPRs than other provinces. The census, which counts everyone in the country every five years, is the best place to start. As shown in Figure 1, according to Census 2021, immigrants and NPRs in Alberta together made up just under a quarter of Albertans living in private households, which is very close to the national figure and about eight percentage points below Ontario and British Columbia.
Figure 1: Share of population that are immigrants or NPRs, Census 2021
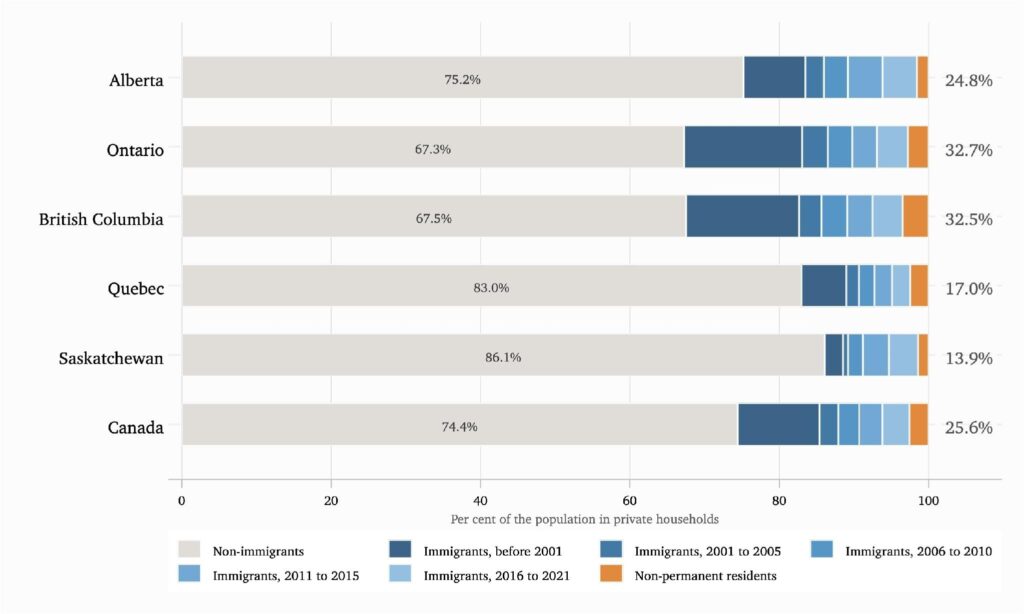
That is, as of Census 2021, Alberta was a typical province when it came to how many immigrants and NPRs live here. But 2021 is a single moment in time and a lot has changed since then. The next question is how these two groups have grown.
The two populations have moved very differently
Immigration to Alberta has grown steadily for about twenty years. As shown in Figure 2, the immigrant share of Albertans aged 15 and over rose from roughly 17% in 2006 to 27% in 2025.2 This is a larger increase than any of the provinces compared except for Saskatchewan, whose immigrant population grew faster. This increase in immigration brought Alberta up to about the national average by 2022.
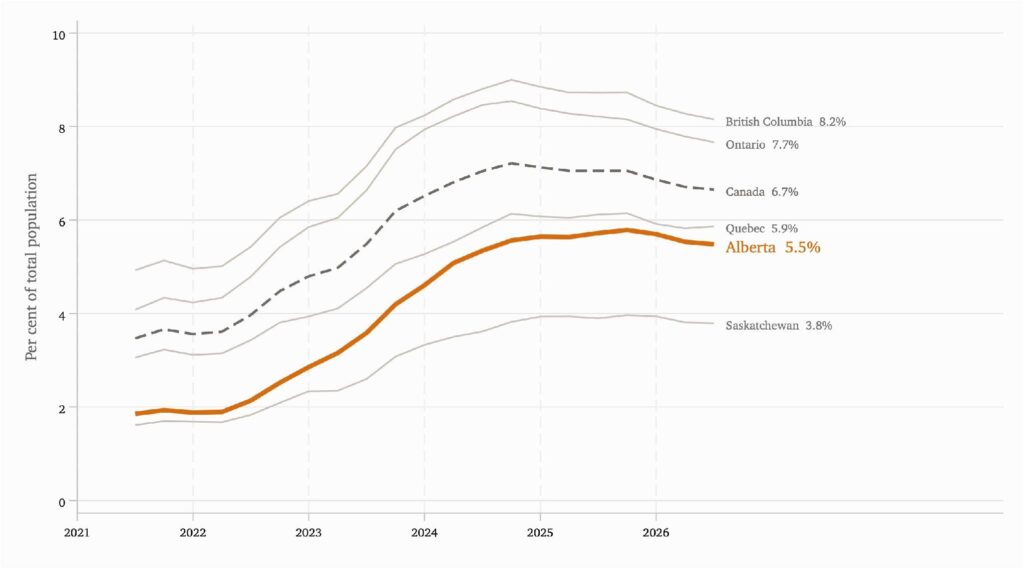
The NPR population is a much more recent story. As shown in Figure 3, Alberta had a little over 80,000 NPRs in mid-2021, which was under 2% of Alberta’s population. By late 2025 that had reached roughly 292,000 NPRs, or close to 6% of Alberta’s population, before declining to about 279,000 NPRs, about 5.5% of Alberta’s population in July 2026. Between 2021 and 2025, Alberta experienced a 3.6-fold increase in NPRs – a growth rate faster than any of the comparison provinces; however, Alberta’s share of NPRs stayed below the national share.
Figure 2: Percent of population aged 15+ that are immigrants, Labour Force Survey, Annualized
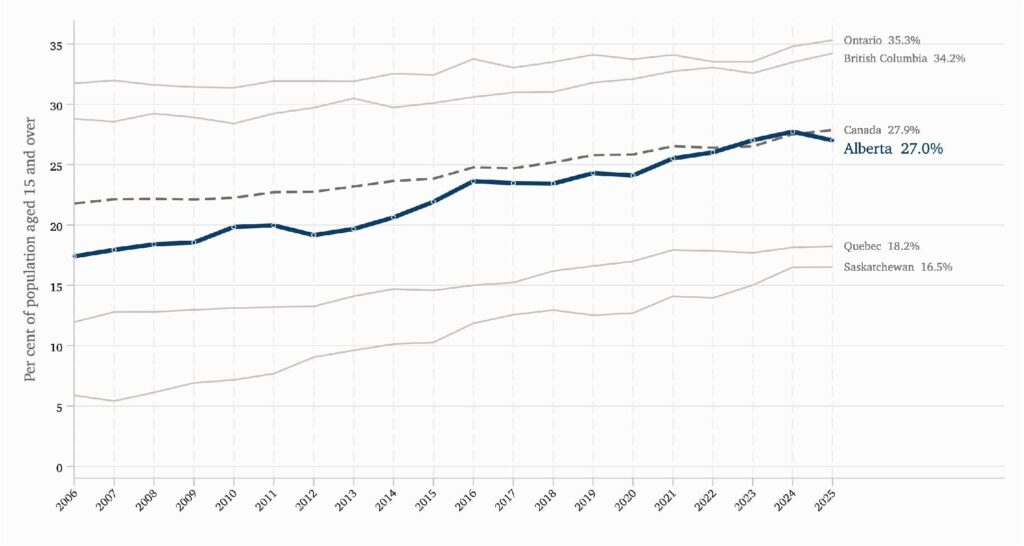
Figure 3: Percent of Population that are NPRs, Quarterly Demographic Estimates
Those are stocks — how many people are here at a given moment. It is worth also looking at the flows, meaning how many arrive or leave in a year.
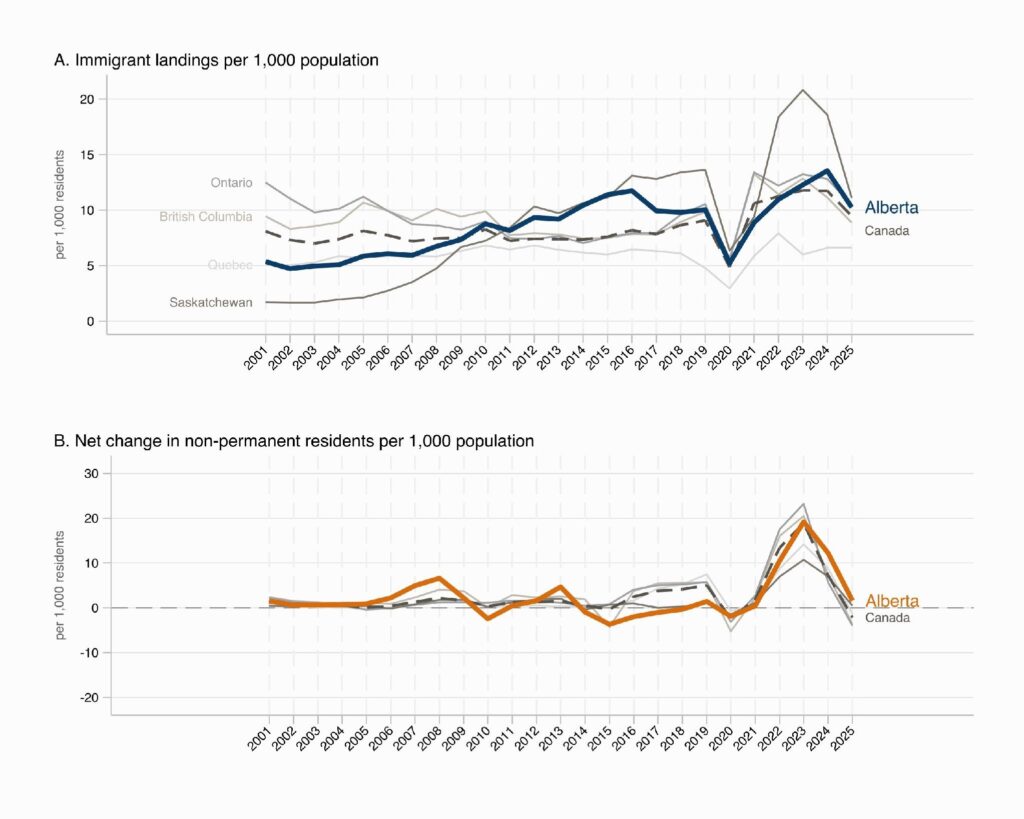
As Figure 4, panel A shows, the number of immigrants arriving in Alberta steadily increased between 2001 and 2015, dipping during the 2015/16 oil crisis and the 2020 COVID-19 pandemic. While arrivals ran a little above trend for the three years after that, by 2025 they were back to roughly where they had been in 2019. In other words, there was no dramatic increase in the number of new immigrants arriving in recent years.
The picture for NPRs looks very different. Panel B of Figure 4 shows change in the number of NPRs each year, meaning the number who arrived minus the number that left or became immigrants. That sat at about zero through 2021, jumped to nineteen per 1,000 by 2023, and has since come back down to almost nothing. So the change in the number of NPRs in Alberta did increase dramatically in recent years and, while that growth has slowed considerably, it has not yet reversed which means Alberta is still gaining a small number of NPRs each year.
The federal government’s policy position is to reduce NPRs to 5% of the Canadian population by the end of 2027. Thus, it is plausible that the number of NPRs in Alberta will decline.
Figure 4: In-flow of Immigrants per 1,000 residents and Net Change in NPRs per 1,000 residents
2 The Labour Force Survey (LFS) is one of the only public data sources that separate immigrants from others and is current. It’s important to note though the LFS is survey data and that in the LFS, NPRs are not a separate category and are included with Canadians-by-birth.
Alberta’s temporary residents are workers
Recall that NPRs must be at least one of: a study permit holder, a work permit holder, or an asylum claimant.
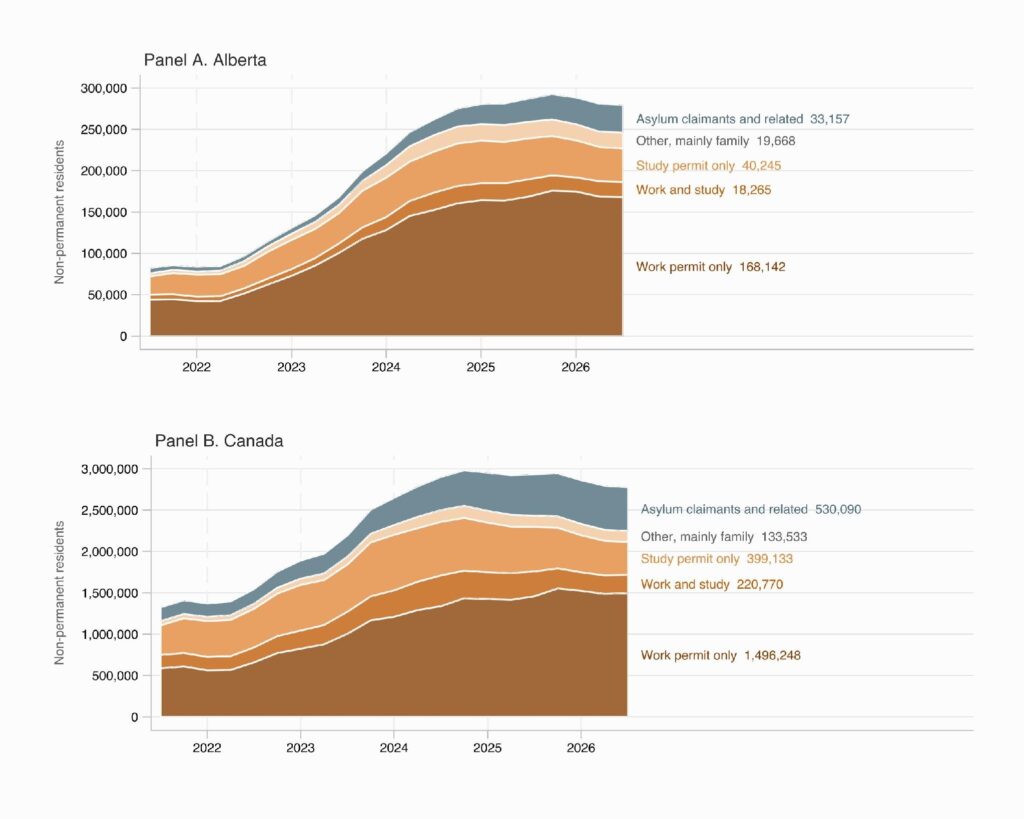
Figure 5 shows the kinds of permits Alberta’s NPRs held in July 2026. About 60% of Alberta’s NPRs hold a work permit only, against 54% nationally. Study permit holders make up 14% of Alberta’s NPRs compared to a national average of 9.3%. Asylum claimants and protected persons are a much smaller share in Alberta — about 12% of Alberta’s NPRs against 19% nationally. The increase since 2021 followed the same pattern, with work permit holders accounting for roughly two-thirds of the people Alberta added.
So when we talk about Alberta’s NPRs, we are for the most part talking about people who came here to work. I will come back to what that work is and what it pays in the next post, because it bears directly on the referendum questions.
Figure 5: Number of NPRs by permit type, Quarterly Demographic Estimates
NPRs who hold work permits have one issued through either the Temporary Foreign Worker program (TFWP) or the International Mobility Program (IMP). Both of these programs contain multiple streams. While different streams have differing criteria, the main difference is that permits under the TFWP are employer sponsored and attached to an employer: an employer must first obtain a labour market impact assessment showing that no Canadian citizen or permanent resident was available to do the work. Under the International Mobility Program (IMP), no such assessment is required because the permit is justified by a broader social, economic or cultural benefit to Canada rather than by a gap in the local labour market. The IMP is made up of more than fifty separate exemptions, covering everything from free trade agreements and working holiday arrangements to the open permits given to people who have graduated from an eligible Canadian post-secondary institution and to the spouses of workers and students.
Figure 6 uses federal government data on the number of people holding a work permit at the end of each year, separated by program, from 2000 to 2024.3 Panel A shows that Alberta has had large numbers of temporary foreign workers before: TFWP permit holders peaked at a little over 46,000 in 2013, fell to under 10,000 by 2018, and although they have climbed again since 2021, they are still below that earlier peak. The IMP grew at about the same rate as the TFWP between 2021 and 2024, roughly quadrupling, but because it started from a much larger base it reached over 100,000 permit holders, far more than Alberta has ever had under either program.
Panels B and C put these numbers on a per-resident basis, dividing the number of permit holders by the province’s population so that Alberta can be compared with provinces of very different sizes. In 2013, Alberta had about 12 TFWP permit holders for every 1,000 residents. This was higher than any other province shown in any year and nearly three times the rate in Saskatchewan, the next highest province that year. Alberta’s rate of TFWP permits has risen again since 2021 and, in 2024, was above the national rate, but below both British Columbia and Quebec: Alberta is no longer the heaviest user of the program.
The IMP shows the opposite pattern. Alberta has had IMP permits per 1,000 residents below the national rate every year since 2017. In 2024, Alberta had about 22 IMP permit holders per 1,000 residents compared with about 30 across Canada.
There are two take-aways. First, there are far more IMP permit holders in Alberta than TFWP permit holders. Second, relative to the population, Alberta draws more heavily than the country on the TFWP—the program that requires employers to obtain a labour market impact assessment showing they could not find a Canadian to fill the job—and less heavily on the IMP—the program that does not require a labour market impact assessment.
Figure 6: Work permit holders by program, IRCC data
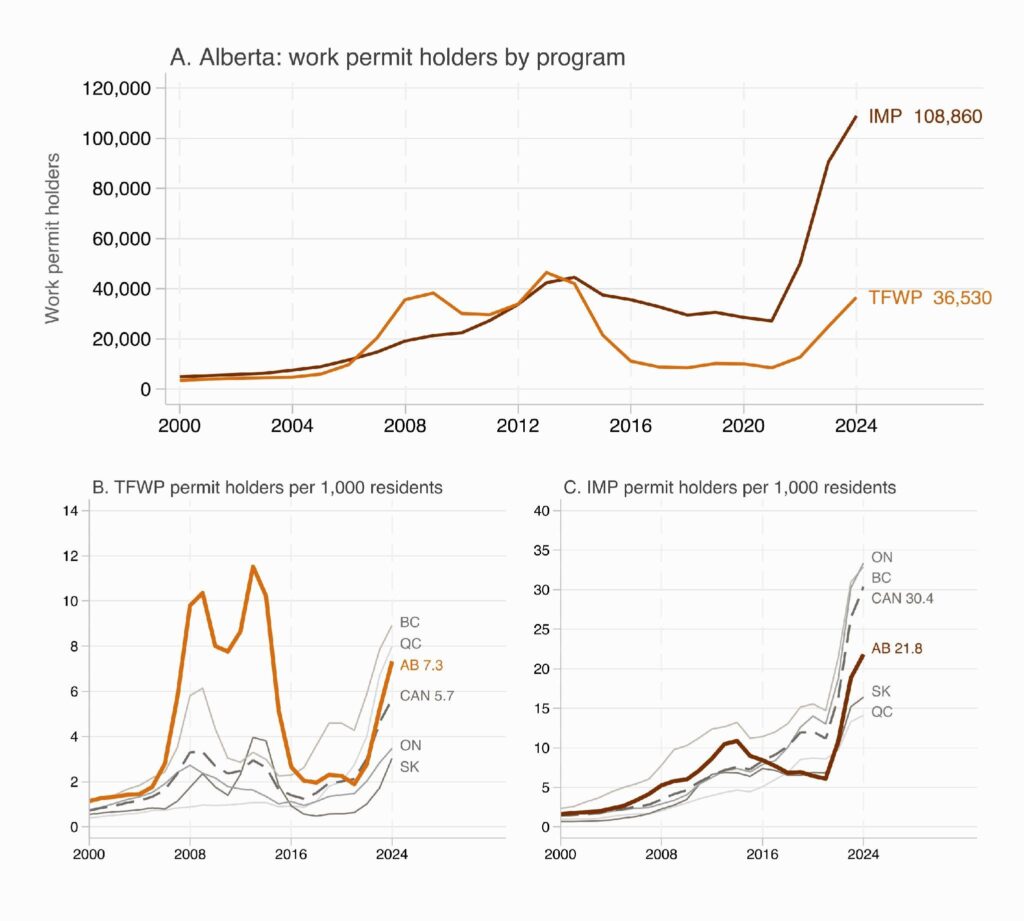
3 Figure 6 uses data from Immigration, Refugees and Citizenship Canada (IRCC) on the number of people holding a valid work permit at the end of each year, separated by program. These data count permits by the province named on the application rather than by where people actually live, and someone who held permits under both programs in the same year is counted in each: the numbers will not line up with the numbers in Figure 5. Further, the most recent year available is 2024 – before the 2025 downturn seen in Figure 3.
What’s next
That is the stage set: an ordinary share of immigrants by national standards though growing at a slightly faster rate over the last decade and an NPR population that grew very fast since 2021, has begun to come down, and is mostly here on work permits. In the next post I will look at what immigrants in Alberta contribute to the labour market, and what this means in terms of taxes, transfers, and services used. After that I will turn to the same questions for NPRs, ending with a post on what this all means for the referendum questions.
What Do Immigrants Contribute to Alberta?
Following my first post on Who is in Alberta, in this post I look at the facts underlying Alberta’s first referendum question on immigration, which asks whether Alberta should take more control over immigration in order to reduce it, prioritize economic migration and give Albertans first priority on new employment opportunities. Joseph Schow, the Minister of Jobs, Economy, Trade, and Immigration Alberta, has been quoted as saying, if the vote goes “yes”: “We as a province can provide those services that people are being told they will have access to when they get there, and a full understanding of what is available to them when they arrive in Alberta…What we’re really saying is we’re making sure that those coming to Alberta have the skills we need to meet the demand today and tomorrow.”
While the purpose of this post is not to unpack these referendum questions nor the official comments surrounding them, underlying this referendum question is a narrative of a province where immigration is out of control, immigrants are not economic contributors and they bring no skills, immigrants are prioritized for jobs, and immigrants are a drain on services.
In my last post, I looked at who is actually in Alberta and found that the province has a fairly ordinary share of immigrants by national standards, a share that has grown steadily over the last twenty years and has begun to decline in 2025 (2026 numbers are not yet available).
In this post, I turn to looking at the economic contributions of immigrants, the skills they bring, the taxes they pay, and the income supports and provincial services they use. These are the questions publicly available data can answer.
To ensure we’re on the same page, there are two things to keep in mind. The first is that this post is about landed immigrants only, meaning people with permanent residence status, whether or not they have since become citizens. Throughout this post, the term “non-immigrants” groups together everyone who is not a landed immigrant, including people who have been Canadian citizens since birth along with non-permanent residents1. The second is that I focus on Albertans aged 25 to 54, which is the core working age. Immigrants are younger on average than non-immigrant Albertans, and looking at everyone aged 15 and over would mix up differences between immigrants and non-immigrants with differences between the young and the retired.
1 Non-permanent residents (NPRs) are persons in Canada temporarily on a work or study permit, or asylum claimants. The data used in this blog post cannot separate NPRs from persons born Canadian citizens. I will come back to NPRs in the next post, using different data that can identify them.
Spoiler Alert
Here are the major take-aways for anyone who doesn’t want to wait for it:
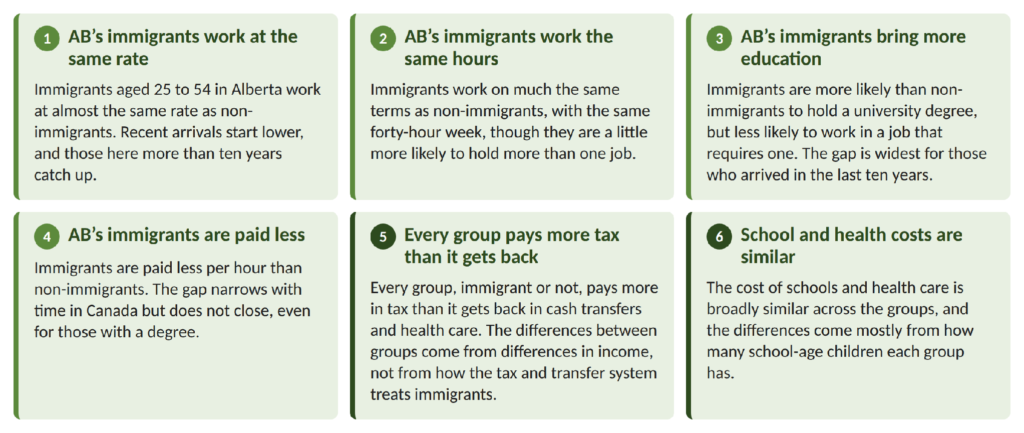
Do immigrants work?
In 2025, immigrants in Alberta ages 25 to 54 were employed at almost exactly the same rate as non-immigrant Albertans ages 25 to 54, with about 82.5% of immigrants working in 2025 compared with about 83.1% of non-immigrants.
How long someone has been in Canada also matters for employment. As Figure 1 shows, immigrants who landed within the previous five years have had the lowest employment rate of any group in almost every year since 2006, and in 2025 they had an employment rate of 74.5%, the lowest of any group.2 The longer immigrants have been here, the closer their employment rate comes to non-immigrants. Immigrants who landed more than ten years ago are, in 2025, slightly more likely to be working than non-immigrant Albertans, at 85.4% in 2025 compared with 83.1%.
Figure 1: Employment rate by time since landing, Albertans aged 25 to 54, 2006-2025
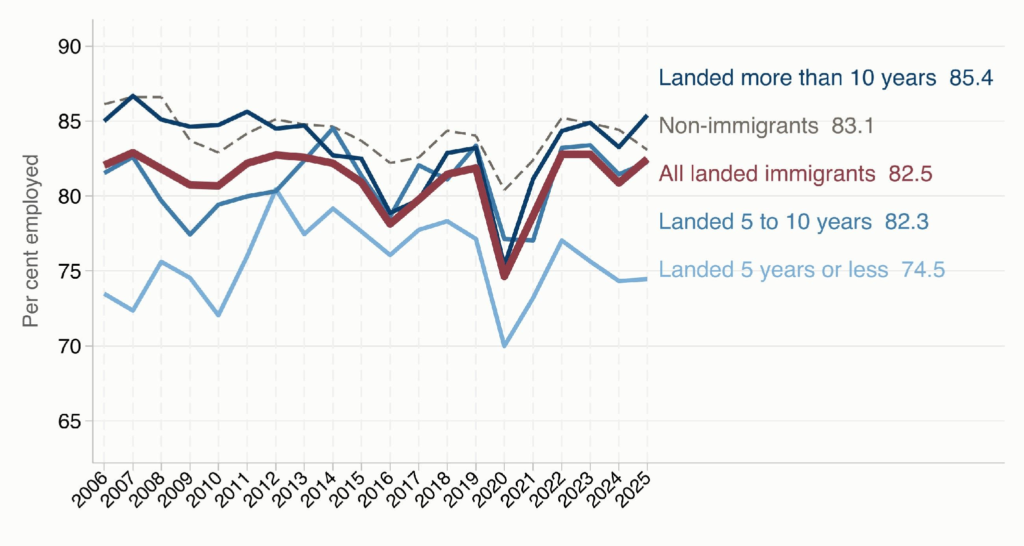
2 The data for Figure 1 comes from Statistics Canada Table 14-10-0472-01, Labour force characteristics of immigrants, annual. Analysis is that of the author and is available upon request. Technical details will be published in a forthcoming report.
What skills do they bring?
Canada’s immigration system is built largely around skills. Most permanent residents are admitted through economic programs that select people based on their education, work experience and language ability. In 2026, 63% of new permanent residents are planned to come through those programs. So it is worth asking whether Alberta’s immigrants bring more education than non-immigrant Albertans, and whether that education is being put to use once they are here.
Figure 2: Degrees held and degrees used, Albertans aged 25 to 54, 2025
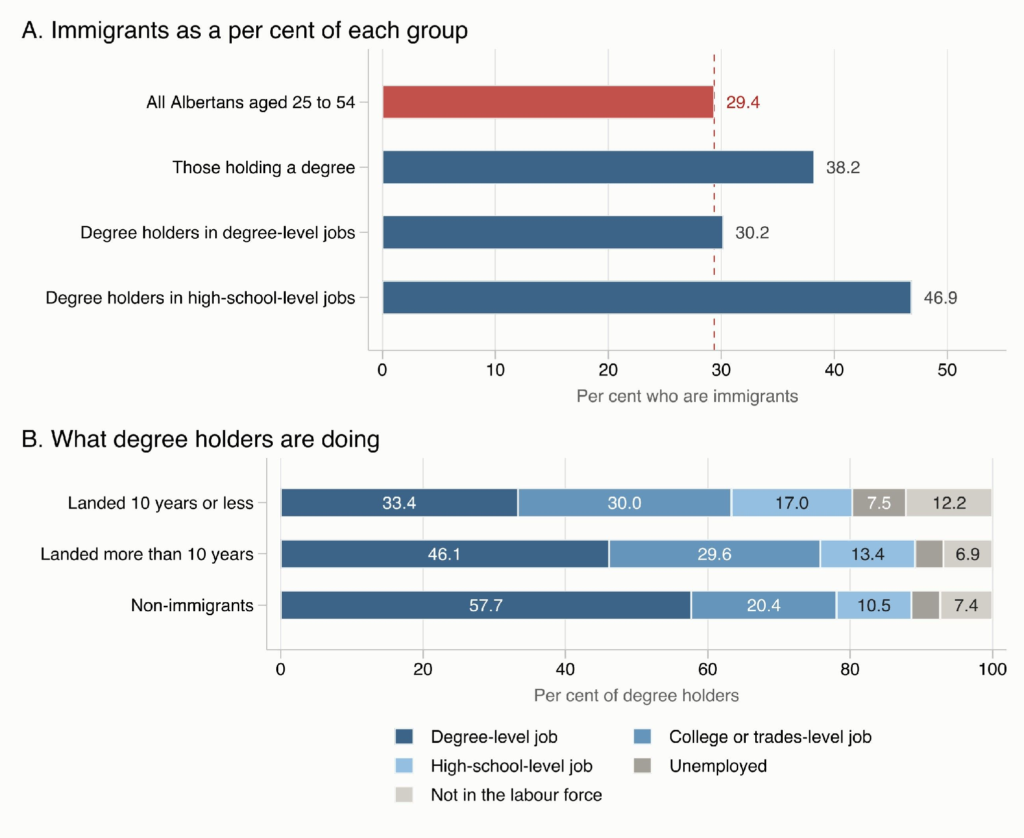
The left-hand panel of Figure 2 answers the first part of that question.3 Immigrants are more likely to be degree holders than non-immigrants. Immigrants make up 29% of Albertans aged 25 to 54, but they hold 38% of the bachelor’s degrees or higher held by people that age.
The right-hand panel of Figure 2 looks at where those degrees end up. To measure this, I look at the occupations immigrants are actually employed in. For each of those occupations, there is a “national occupational classification”, which sorts occupations by the education they normally require. I compare the occupation an immigrant works in with the education they have.
Among non-immigrant Albertans with a degree, 58% work in a degree-level job. For immigrants who have been here more than 10 years and who hold a degree, 46% of them hold an occupation that requires a degree. Of immigrants who have arrived 10 years or less ago and have a degree, 33% hold a job that requires a degree. For recent immigrants, part of the gap is that many are not yet working, and about one in five recent immigrant degree holders is unemployed or out of the labour force, nearly twice the rate for other degree holders.
The data I use cannot say why immigrants’ education and occupations do not match as well, but Canadian research points to immigrants’ skills being under-used, to the difficulty immigrants have entering regulated professions where a foreign credential often has to be re-certified, and to discrimination by employers. In recognition of these issues, Alberta set up its own Foreign Credential Advisory Committee in 2024 to look at how internationally trained professionals can more easily enter regulated professions in the province.
3 The data for Figure 2 comes from the Labour Force Survey Public Use Microdata file. Analysis is that of the author and is available upon request. Technical details will be published in a forthcoming report.
How they work and what they are paid
Employed immigrants ages 25 to 54 in Alberta put in much the same work hours as employed non-immigrants ages 25 to 54 in Alberta.4 The typical core-age worker in Alberta, immigrant or not, usually works a forty-hour week. Immigrants are, if anything, slightly less likely than non-immigrant Albertans to work part-time. Where they do differ is that immigrants are more likely to hold more than one job: about 8% or 9% of immigrants hold multiple jobs compared with about 5% of non-immigrant Albertans.
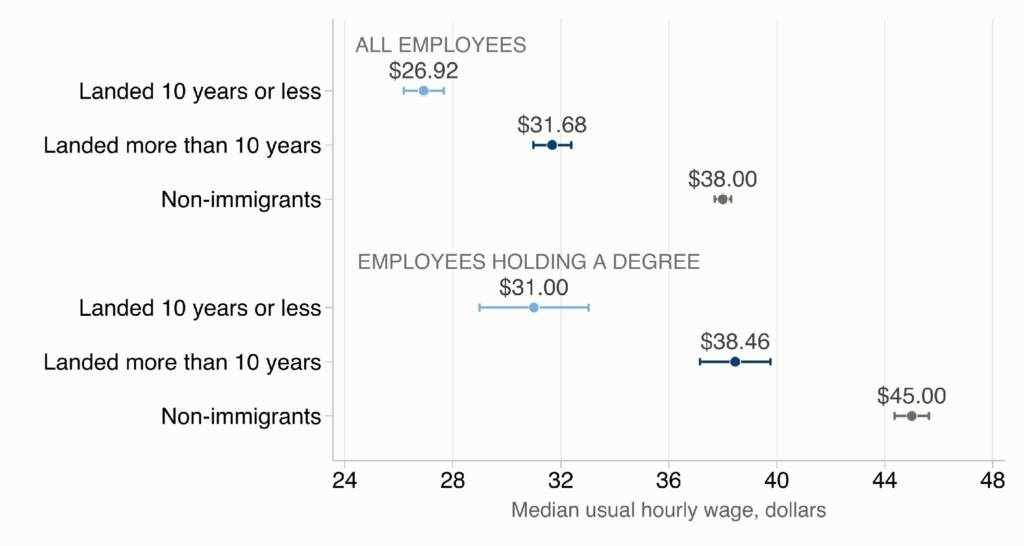
What they are paid is a different matter. As Figure 3 shows, the median hourly wage in 2025 was $38.00 for non-immigrant Albertans aged 25 to 54, compared with $31.68 for immigrants who have been here more than ten years and $26.92 for immigrants who arrived within the last ten years. The gap narrows with time in Canada but does not close. And, as the lower half shows, holding a degree does not close it either, with recent immigrants who have a degree earning a median of $31.00 an hour against $45.00 for other degree holders. That is consistent with the previous section, where immigrants with degrees were less likely to be working in jobs that require one.
Figure 3 does not measure the cause of the gap: it does not adjust for differences in age, industry or occupation. But because immigrants work the same hours as everyone else, a lower hourly wage means lower earnings over the year, and that is where the question of taxes and transfers begins.
Figure 3: Median hourly wage, Alberta employees aged 25 to 54, by immigrant status, 2025
4 The data and analysis underlying this section comes from the Labour Force Survey, Public Use Microdata file. Analysis done by the author and available upon request. Technical details will be published in a forthcoming report.
What that means for taxes and transfers
Let’s start with the punchline: every group examined in this post pays more taxes than it receives back in transfers and health care. This may not be true for every single individual, but for groups, it holds. Figure 4 shows how much each group received back in cash transfers and provincial health care for every dollar it paid in federal, provincial, payroll, or commodity tax in 2025.5
Immigrants aged 25 to 54 who landed within the last ten years receive about 70 cents for every dollar of tax they pay. Immigrants who have been here more than ten years receive about 55 cents, and non-immigrants receive about 47 cents. The rest of this section explains why the three groups differ, and the short answer is income.
Figure 4: Cash transfers and health care received per dollar of tax paid, Albertans aged 25 to 54, 2025
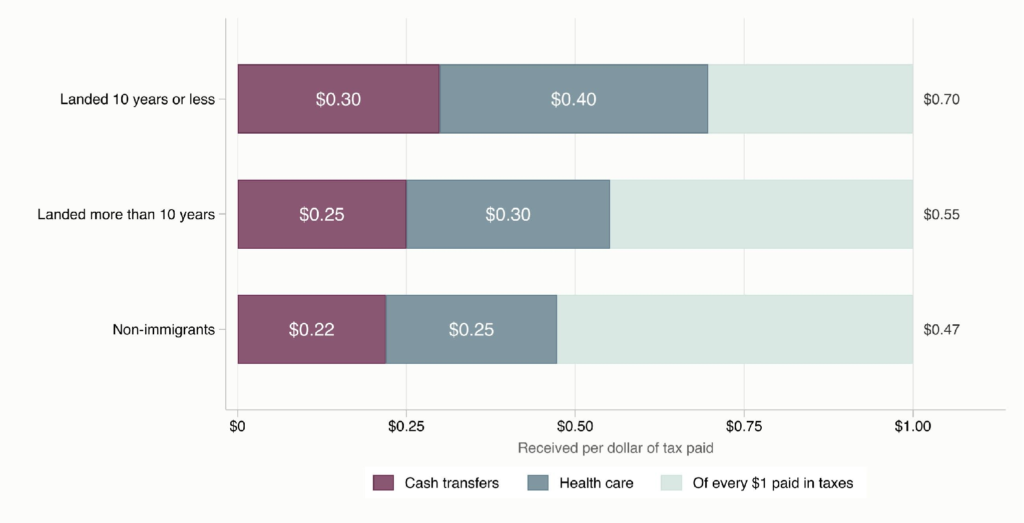
Before going further, it is worth explaining what goes into Figure 4. The taxes counted are the ones most people pay every year: federal and provincial income tax, the Canada Pension Plan and Employment Insurance premiums taken off each paycheque (sometimes called “payroll taxes”), and commodity taxes such as the GST and the taxes on fuel, alcohol and tobacco. The cash transfers are the benefits that flow through the tax system or have to be reported on a tax return, such as the Canada Child Benefit (CCB), the GST credit, Employment Insurance (EI), workers’ compensation and provincial income and disability support. Both come from Statistics Canada’s Social Policy Simulation Database and Model (SPSD/M), which applies the 2025 tax and benefit rules to a representative sample of Canadians.
Health care is included in Figure 4 because it is the largest service government provides and it is paid for out of the same general tax revenue included above. Its cost is based on what the Alberta government spends on health care for people by age, including their children: it is an average for people of that age rather than what anyone actually used. K-12 education is not added even though it is also a large public service because about a third of it is paid for through the education property tax, which is not among the taxes counted and cannot be measured for each group. Adding education without its property tax would count what schools cost without counting part of what pays for them.
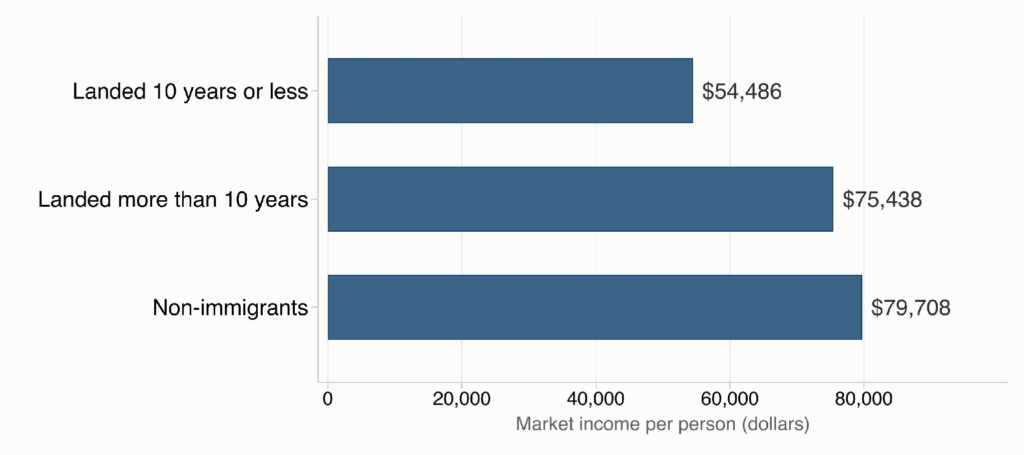
To see why the groups differ, the place to begin is market income. Market income is everything people earn before any taxes or transfers. It includes income from employment, investments and capital, and pensions. As Figure 5 shows, recent immigrants had the lowest market income of the three groups, and immigrants who have been here more than ten years earned a little less than non-immigrants.6 That is consistent with the previous section where we saw that the three groups work the same hours at different hourly wages.
Figure 5: Market income per person, Albertans aged 25 to 54, 2025
Canada’s tax system is designed so that people who earn more pay more, and Figure 6 shows exactly that.7 The taxes counted here are federal and provincial income taxes, along with payroll taxes (Canada Pension Plan and Employment Insurance premiums) and commodity taxes such as the GST. In dollars, recent immigrants paid about $8,000 a year less in tax than non-immigrants. However, as a share of what they earned, recent immigrants paid only about two percentage points less. In other words, almost all of the difference in what the groups pay comes from what they earn, not from how the tax system treats them.
Figure 6: Taxes paid per person and as a share of market income, Albertans aged 25 to 54, 2025
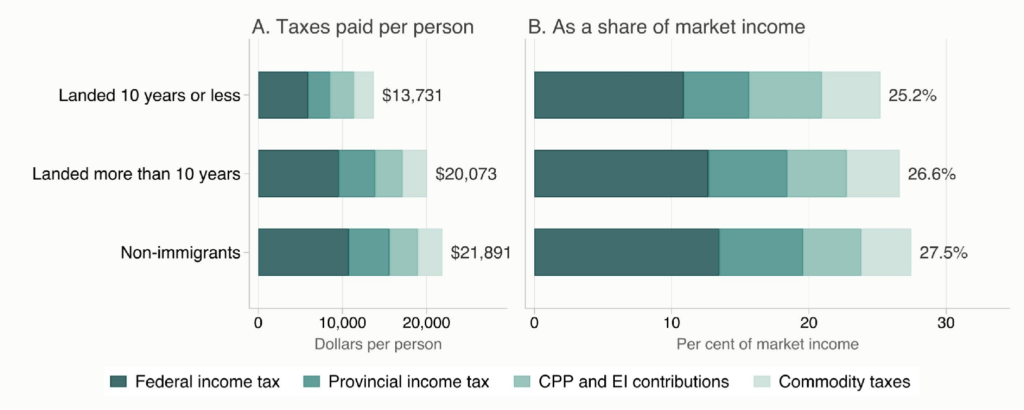
Figure 7: Transfers received per person and as a share of market income, Albertans aged 25 to 54, 2025
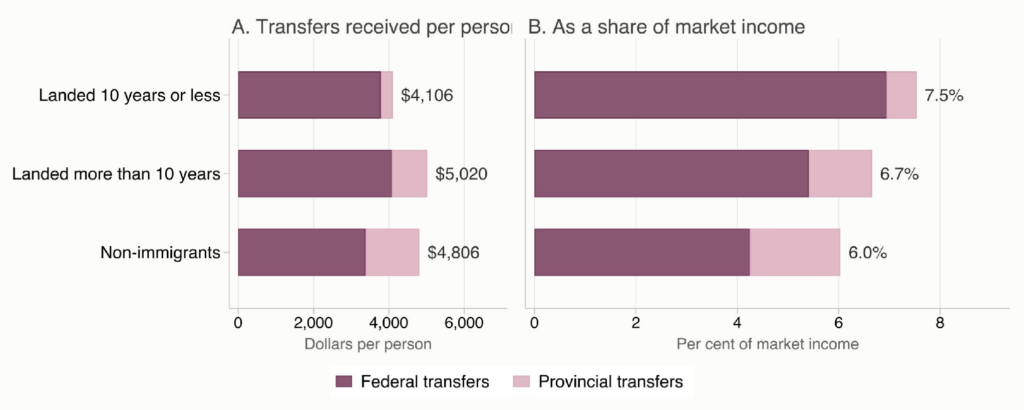
Transfers work the other way from taxes. Programs like the CCB, the GST credit, EI, and provincial income assistance are designed to give more to people who earn less or lose work. As Figure 7 shows, the dollar amounts are close across the three groups: recent immigrants received somewhat less than non-immigrants, and immigrants who have been here more than ten years received slightly more.8 Measured against income, though, recent immigrants received the most because their incomes are the lowest. Put together with the tax figures, this is why recent immigrants get back the most per dollar of tax in Figure 4: they pay less tax because they earn less, while the transfers they receive are close to what everyone else receives.
So far this section has been about money that flows through the tax system, but government also provides services, and the two largest are health care and schools. What these services cost for each group is broadly similar, and the differences that do exist come mostly from how many school-age children each group has. Figure 8 shows what K-12 education and health care cost per person.9 Services for immigrants who have been here more than ten years cost the most in dollars because more of them have school-age children. Services for recent immigrants cost the least in dollars, but because their incomes are the lowest, these services are the largest relative to what they earn.
Figure 8: K-12 education and health care received per person and as a share of market income, Albertans aged 25 to 54, 2025
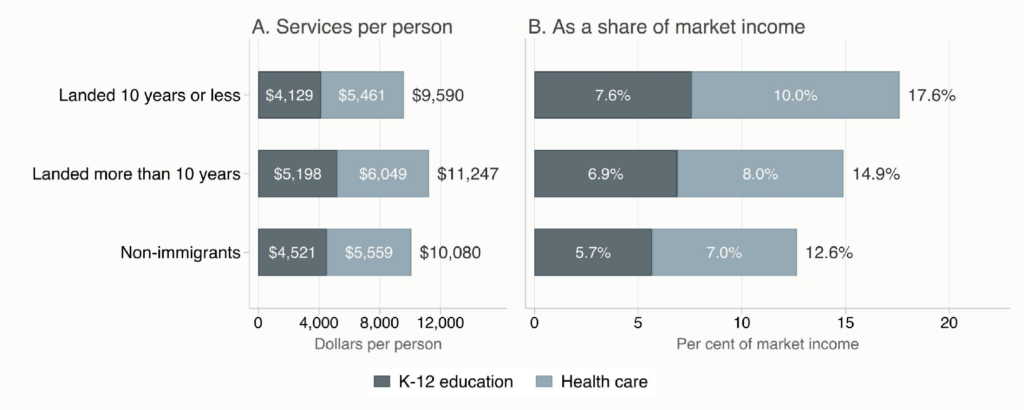
A few cautions are worth keeping in mind. Health care costs here are averages for people of a given age, not what anyone actually used. Further, because research finds that recent immigrants tend to be healthier than other Canadians, their health care figure is likely too high rather than too low. These numbers are also a snapshot of a single year, so they say nothing about what people will pay or receive over the rest of their lives, and they leave out other things government provides, such as post-secondary education, justice and roads.
5 Figure 4 is calculated using the SPSD/M. Technical details will be provided in a forthcoming report and are available upon request.
6 Figure 5 shows per person market income. It takes all the market income for the entire group and divides it by the number of persons in the group. It is calculated using the SPSD/M. Technical details will be provided in a forthcoming report and are available upon request.
7 Figure 6 shows per person taxes. It takes all the taxes for the entire group and divides it by the number of persons in the group. It is calculated using the SPSD/M. Technical details will be provided in a forthcoming report and are available upon request.
8 Figure 7 shows per person transfers. It takes all the transfers for the entire group and divides it by the number of persons in the group. It is calculated using the SPSD/M. Technical details will be provided in a forthcoming report and are available upon request.
9 Education costs are Alberta’s 2023–24 K-12 spending on public schools, divided by public school enrolment, adjusted to 2025 and shared out by the number of school-age children in each group. Health care costs are Alberta’s spending per person by age, from the Canadian Institute for Health Information, applied to each adult and their children. Both are averages, not what any individual used.
What’s next
In this post I have looked only at landed immigrants. In the next post I will turn to non-permanent residents, who make up a large share of Alberta’s recent population growth and who are the subject of three of the four referendum questions. I will look at what work they do, how that lines up with the jobs Alberta has trouble filling, and what can be said about the taxes they pay and the transfers they receive. After that, I will bring everything together in a final post on what the evidence means for the referendum questions.
What Do Non-Permanent Residents Contribute to Alberta?
In my first post, I looked at who is actually in Alberta, and in my second post I looked at what landed immigrants contribute through their work and the taxes they pay. In this post, I turn to non-permanent residents (NPRs). These are the people living in Alberta on a work permit or a study permit, or who have claimed refugee status, along with the family members who live with them.
The four immigration questions on the non-binding October 19th referendum bear on NPRs. The first question asks about whether the province should have more control over immigration to reduce it and to give Albertans first priority on new jobs. The next three ask whether there should be limits or fees on provincial services for NPRs.1
While the purpose of this post is not to unpack these questions, taken together they suggest a particular narrative: that there are too many NPRs in Alberta and those that are here are taking Albertans’ jobs, and that the pressure on Alberta’s health care and education systems comes from large numbers of NPRs who use these services without paying for them. Premier Danielle Smith’s recent social media posts, which I showed in my first post, support this narrative.
As my first post showed, the number of NPRs in Alberta grew very quickly after 2021, from a little over 80,000 people, under 2% of Alberta’s population, to a peak of about 292,000, close to 6% of the population, in late 2025. Even at its peak, Alberta’s share of NPRs stayed below the national share. Since then, the number of NPRs has begun to come down, to about 279,000 in July 2026, and with the federal government aiming to reduce NPRs to 5% of Canada’s population by the end of 2027, it is plausible that it will keep falling.
In this post, I continue to examine the facts about NPRs in Alberta by asking how many NPRs in Alberta are working and where, whether they are paying taxes, and which provincial programs and supports they are able to use.
As in my last post, I focus on Albertans aged 25 to 54, the core working age. Most of the data used in this post is the 2021 Census public use microdata file, which reports people’s income for 2020. Public data sources with more recent data are unable to separately identify NPRs for the purposes of examining employment, income and taxation. This means most of the numbers here describe 2020, a year shaped by the COVID-19 pandemic, and they cannot be compared directly with the numbers in my last post. I compare NPRs with three groups: immigrants who landed within the previous ten years, immigrants who landed more than ten years ago, and Canadians-by-birth, meaning people who have been Canadian citizens since birth.
1 The full wording of all four questions is available from Elections Alberta at https://www.elections.ab.ca/elections/referendum/.
Spoiler Alert
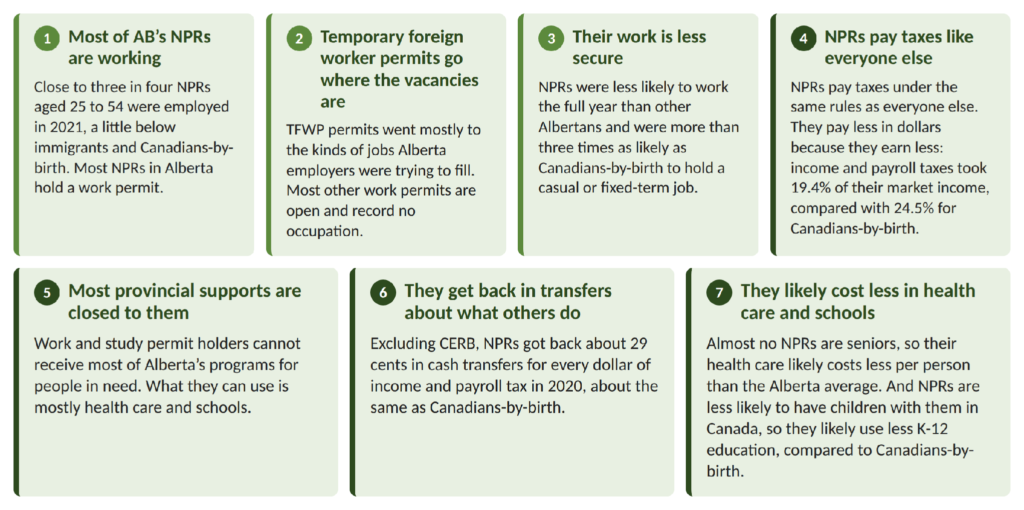
As with my other posts, I first offer the major take-aways:
Are they working?
As I showed in my first post, most of Alberta’s NPRs are here on a work permit. In July 2026, about 67% of Alberta’s NPRs held a work permit or a work and study permit. Work permit holders accounted for roughly two-thirds of the NPRs Alberta added after 2021.
Holding a permit that allows work is not the same as working and the permit data cannot tell us whether anyone actually has a job. For that, the 2021 Census is the only source that identifies NPR employment. As Figure 1 shows, in May 2021, 72.2% of NPRs aged 25 to 54 in Alberta were employed.2 That is lower than for Canadians-by-birth, at 78.4%, and for immigrants, who were employed at about 77% whether they had landed within the previous ten years or earlier. But it still means that close to three in four core-age NPRs were working. Part of the gap likely comes from NPRs who are not here mainly to work, such as students and asylum claimants; however, the census cannot separate them from work permit holders. One caution is that the NPR population in 2021 was less than a third of its size today, so the census describes a smaller group than the one in Alberta now.
Figure 1: Employment rate by immigrant status, Albertans aged 25 to 54, 2021
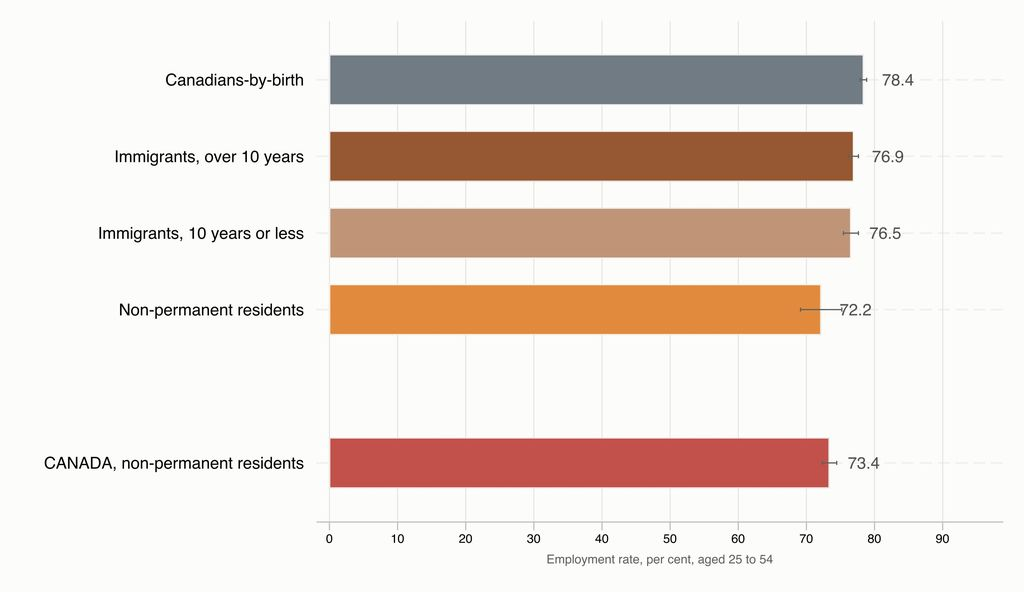
2 The data for Figure 1 comes from the Statistics Canada 2021 Census of Population Public Use Microdata File. The “whiskers” are 95% confidence intervals. For all figures/data using census data in this post, the census undercounts NPRs and does not include people living in collective dwellings, such as work camps and student residences. Analysis is that of the authors and is available upon request. Technical details will be published in a forthcoming report.
What work do they do?
Knowing that most NPRs work raises the next question: what jobs are they doing, and are they jobs Albertans could have filled? The best evidence comes from comparing permits under the Temporary Foreign Worker Program (TFWP), the program that records the occupation, to job vacancies. Recall that before hiring through the TFWP, an employer must show that no Canadian citizen or permanent resident was available to do the job. For the other work permit program — the International Mobility Program (IMP) — where no such assessment is required, about 87% of Alberta’s IMP permits in 2025 were open permits not tied to a job, so no occupation is recorded.
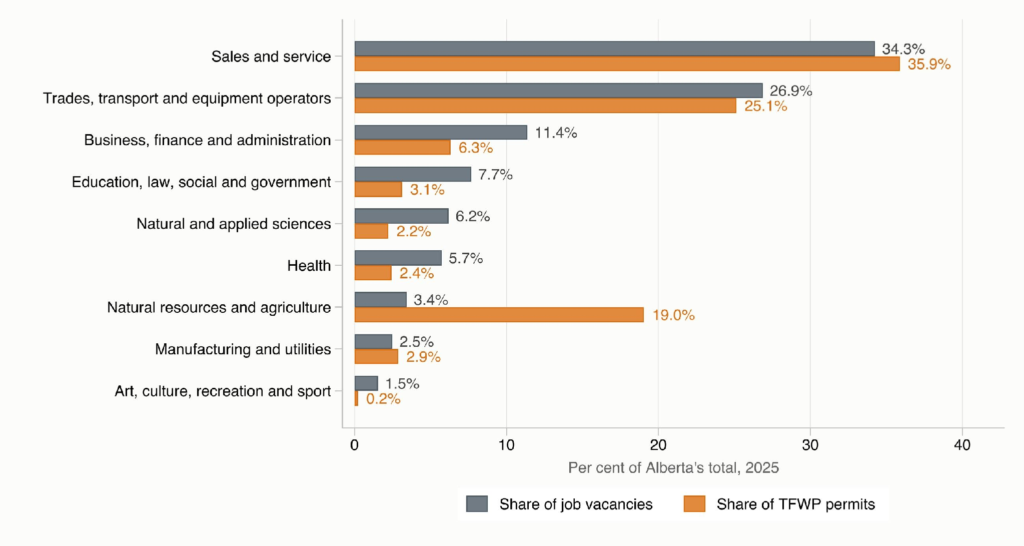
Figure 2 shows the share of job vacancies in 2025 (gray bars) against the share of TFWP permits in 2025 (orange bars) by broad occupation.3 Figure 2 suggests that TFWP permits went largely to the kinds of jobs Alberta employers were struggling to fill. The share of permits in sales and service, and in the trades and transport, closely matched the share of job vacancies in those occupations. Agriculture is the exception, with far more permits than vacancies.
This figure should be read with a caveat: this match does not on its own show that temporary workers are filling shortages. Many of these jobs are among the lowest paid in the province, and a job can stay vacant because there are not enough workers or because residents will not take it at the wage offered.
Figure 2: Share of Alberta’s job vacancies and of its TFWP permits, by broad occupational category, 2025
3 The data for Figure 2 comes from Statistics Canada Table 14-10-0444-01 (job vacancies, average of the four quarters of 2025) and Immigration, Refugees and Citizenship Canada’s monthly data on TFWP work permit holders (permits taking effect in 2025). Senior management occupations are not shown because the two sources classify them differently. Analysis is that of the authors and is available upon request. Technical details will be published in a forthcoming report.
How steadily do they work?
Figure 1 showed that close to three in four NPRs were working in a single week in May 2021, but it does not tell us how steadily they worked. For that, I return to the census, which records how much of 2020 each person worked and what kind of job they held. Table 1 shows that NPRs worked less of the year and on less secure terms than other Albertans.4 Of the NPRs who worked at some point in 2020, fewer than half (47%) worked the full year, compared with nearly two-thirds (65%) of Canadians-by-birth. And about one in three (33%) employed NPRs held a casual or fixed-term job, more than three times the share among Canadians-by-birth (9%). So most NPRs are working, but their work is less continuous and less secure than that of other Albertans, and that shapes what they earn and the taxes they pay, which is where the next section picks up.
Table 1: Work in 2020 and type of job held, Albertans aged 25 to 54
| % worked in 2020 | % worked part-time | % worked less than 30 weeks | % worked full year (49-52 weeks) | % worked casual/fixed term job | ||
| Alberta | Canadians-by-birth | 83.9 | 14.6 | 17.8 | 64.8 | 9.3 |
| Immigrants, over 10 years | 81.5 | 16.2 | 20.1 | 61.0 | 9.5 | |
| Immigrants, 10 years or less | 79.8 | 15.8 | 22.6 | 55.5 | 14.2 | |
| Non-permanent residents | 73.4 | 19.9 | 27.8 | 46.6 | 32.7 | |
4 The data for Table 1 comes from the Statistics Canada 2021 Census of Population Public Use Microdata File. All differences between NPRs and Canadians-by-birth in Table 1 are statistically significant. Analysis is that of the authors and is available upon request. Technical details, including standard errors, will be published in a forthcoming report.
Are they paying taxes?
NPRs who work pay taxes the same way as everyone else who works in Alberta. Income tax comes off their paycheques under the same federal and provincial rules, they pay Canada Pension Plan (CPP) and Employment Insurance (EI) premiums on their earnings, and they pay the GST and the taxes on fuel, alcohol and tobacco whenever they buy something.
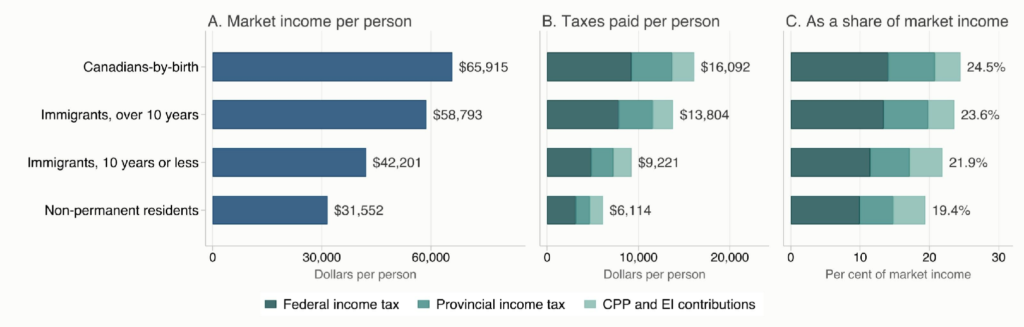
As Panel B of Figure 3 shows, in 2020 NPRs aged 25 to 54 in Alberta paid $6,114 per person in income tax and payroll premiums, compared with $16,092 for Canadians-by-birth.5 Most of that gap comes from what they earn rather than how they are taxed. As Panel A shows, NPRs had market income less than half as much as Canadians-by-birth.6 This is consistent with the previous section that found NPRs worked less of the year on less secure terms. And, because Canada’s income tax is progressive, people with lower incomes pay a smaller share of what they earn. Measured against their income (Panel C), NPRs paid 19.4% in taxes compared with 24.5% for Canadians-by-birth. These totals also leave out the GST, other commodity taxes and property taxes because the census does not record these.
Figure 3: Market income and taxes paid per person, and taxes as a share of market income, Albertans aged 25 to 54, 2020
In other words, NPRs who work are paying into the same federal and provincial tax system that pays for public services, including Alberta’s health care, schools and social supports. The next question is what they are able to get back from it.
What can they get?
The government supports NPRs are able to access is a question of law rather than of data: it depends on the kind of status a person holds. Table 2 sets out who is eligible for the main Alberta-funded programs, from health care and schools to income, disability, housing and child care supports, for citizens, permanent residents and each kind of NPR. It describes entitlement rather than use: it says what a person with each status may apply for, not what anyone actually receives.
Table 2: Eligibility for Alberta-funded social supports by program and immigrant/NPR status
✓ eligible ✗ not eligible ◐ eligible subject to conditions — not applicable * see notes
“Protected person” means a person with a positive refugee determination who has not yet become a permanent resident and is distinguished throughout from a refugee claimant whose claim is undecided.
| Program | Canadian citizen | Permanent resident | Work permit | Study permit | Refugee claimant | Protected person | Spouse of an NPR | Dependent child of an NPR |
|---|---|---|---|---|---|---|---|---|
| Health | ||||||||
| Alberta Health Care Insurance Plan (AHCIP) | ✓ | ✓ | ◐ | ◐ | ✗ | ✓ | ◐ | ◐ |
| Alberta Child and Adult Health Benefit (ACAHB) | ✓ | ✓ | ✗ | ✗ | ✓ | ✓ | ✗ | ✗ |
| Education | ||||||||
| K–12 education | ✓ | ✓ | — | ◐ | ✓ | ✓ | — | ✓ |
| Income supports | ||||||||
| Income Support | ✓ | ✓ | ✗ | ✗ | ✓ | ✓ | ✗ | — |
| Alberta Child and Family Benefit (ACFB) | ✓ | ✓ | ◐ | ◐ | ✗* | ✓ | ◐ | — |
| Escaping Abuse Benefit | ✓ | ✓ | ✗ | ✗ | ✓ | ✓ | ✗ | — |
| Disability supports | ||||||||
| AISH / ADAP | ✓ | ✓ | ✗ | ✗ | ✗ | ✗ | ✗ | — |
| Family Support for Children with Disabilities (FSCD) | ✓ | ✓ | ✗ | ✗ | ✗ | ✗ | ✗ | ◐* |
| Persons with Developmental Disabilities (PDD) | ✓ | ✓ | ✗ | ✗ | ✗ | ✗ | ✗ | — |
| Housing | ||||||||
| Social housing | ✓ | ✓ | ✗ | ✗ | ◐* | ◐* | ✗ | ✗ |
| Rent Assistance Benefit | ✓ | ✓ | ✗ | ✗ | ◐* | ◐* | ✗ | ✗ |
| Child care | ||||||||
| Reduced child care fees (affordability grant) | ✓ | ✓ | ✓ | ✓ | ✓ | ✓ | ✓ | ✓ |
| Crisis supports | ||||||||
| Emergency and women’s shelters | No status condition is published for access to emergency shelter | |||||||
| Legal supports | ||||||||
| Legal Aid Alberta | ✓ | ✓ | ✓ | ✓ | ✓ | ✓ | ✓ | ✓ |
Notes for Table 2:
- Alberta Child and Family Benefit, refugee claimant. Alberta uses the federal definition of who is eligible for the Canada Child Benefit. The Canada Revenue Agency states that a person whose refugee claim has not yet been decided is not eligible. A claimant who is later recognized as a protected person becomes eligible.
- Family Support for Children with Disabilities (FSCD), dependent child of an NPR. Eligibility depends on the child’s status, not the parents. A child born in Canada to NPR parents is a Canadian citizen and is eligible; a child who came to Canada with a parent on a work or study permit is not.
- Social housing and the Rent Assistance Benefit, refugee claimant and protected person. The regulation covers refugees sponsored by the Government of Canada, and people who have applied for refugee or immigration status and whose private sponsorship has broken down. Neither description fits a refugee claimant or a protected person exactly. The Rent Assistance Benefit website lists applicants for refugee or immigrant status without the sponsorship condition in the regulation.
Table 2 shows that work and study permit holders are not eligible for most of the programs meant for Albertans with the lowest incomes or the greatest needs.7 They cannot receive Income Support, AISH or ADAP, the Alberta Child and Adult Health Benefit (i.e. health benefits for Albertans in low-income households), supports for children or adults with disabilities, social housing, the Rent Assistance Benefit or the Escaping Abuse Benefit. Refugee claimants are treated differently. They can receive Income Support and the Child and Adult Health Benefit, though not disability supports. Note that all of these are paid out of provincial tax revenue, which NPRs contribute to.
NPR permit holders can access the more “universal” programs that are generally available to all Albertans regardless of income. They are covered by Alberta’s health insurance plan if they establish residence, intend to stay at least twelve months and hold a permit with at least six months left to run. Their children can attend a child care facility at a reduced fee through the Affordability grant and attend school on the same terms as other children living in Alberta. NPRs can also receive the Alberta Child and Family Benefit, but only after eighteen months in Canada. In other words, the provincial services NPRs on a permit can reach are mostly health care and schools, while the supports Alberta provides to those most in need are, for the most part, closed to them.
Table 2 describes what NPRs may apply for. Figure 4 turns to what they actually received in 2020 in cash transfers from both the federal and provincial governments, such as child benefits, Employment Insurance, the GST credit and provincial income support. Using the Census data, NPRs received the least of any group, $1,795 per person, compared with $4,300 for Canadians-by-birth and $5,045 for immigrants who had landed within the previous ten years. The largest difference is in child benefits. NPRs on a permit can only receive the Canada Child Benefit and the Alberta Child and Family Benefit after eighteen months in Canada, refugee claimants only once their claim has been accepted and NPRs are also less likely than Canadians-by-birth to have children living with them in Canada.
Figure 4: Transfers received per person and as a share of market income, Albertans aged 25 to 54, 2020, excluding CERB
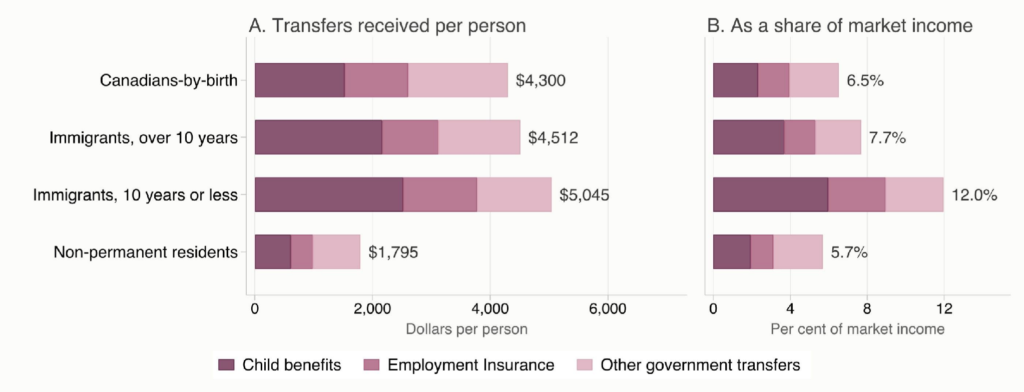
Measured against their income, NPRs received 5.7% compared with 6.5% for Canadians-by-birth. Because the census does not separate federal from provincial transfers, Figure 4 includes federal benefits as well as the provincial programs in Table 2. The amounts also exclude the Canada Emergency Response Benefit (CERB) but still include other pandemic measures, such as the temporary expansion of Employment Insurance and one-time top-ups to child benefits and the GST credit.8
7 Eligibility in Table 2 is drawn from Alberta legislation and regulations, federal legislation and Government of Alberta program guidance, current to September 2026. The row for emergency and women’s shelters follows The Muttart Foundation’s eligibility matrix. The full sources for each program are available on request and will be published in a forthcoming report.
8 This excludes CERB, a one-time pandemic benefit; with CERB included, NPRs received more back per dollar of tax than Canadians-by-birth, which fits the less secure work in Table 1. The data for Figure 4 comes from the Statistics Canada 2021 Census of Population Public Use Microdata File.
Ratio of Transfers-to-Taxes
Figure 5 puts the two sides together: it asks for every $1 of tax paid by a group in 2020, how much did they receive back in cash transfers. In 2020, NPRs received 29 cents back in cash transfers for every $1 of taxes they paid. That is about the same as Canadians-by-birth, at 27 cents, and well below immigrants who had landed within the previous ten years, at 55 cents.
Figure 5: Cash transfers received per dollar of income and payroll tax paid, Albertans aged 25 to 54, 2020, excluding CERB
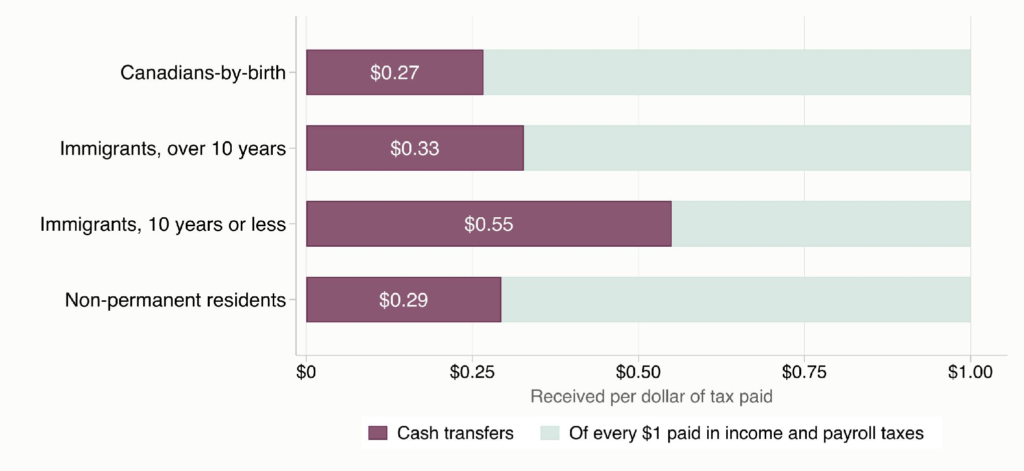
Figure 5 counts cash transfers only. It does not include the cost of health care or schools, which, as Table 2 shows, are the main provincial services NPRs can use, because the census does not have the information needed to estimate what they cost for each group. However, we can use the Census to make inferences. First, as stated previously, NPRs are less likely than Canadians-by-birth to have children with them in Canada in 2021: in the 2021 Census, 33.1% of NPRs aged 25 to 54 had a child in their census family, against 59.1% of Canadians-by-birth.9 While the Census PUMF files do not tell us the age or exact number of children, this lower likelihood of children suggests that NPRs are less likely to use K-12 education for their children than Canadians-by-birth.
The census cannot tell us what health care NPRs use, but their ages tell us something. Health spending rises steeply with age, and almost no NPRs are seniors: in 2023, about 1% of Alberta’s NPRs were 65 or older, compared with 15% of all Albertans. If NPRs used health care at the same rate as other Albertans their age, Alberta would have spent about $3,700 per NPR in 2023, compared with an average of about $5,900 per Albertan.10 That is an estimate and may be too high as some NPRs do not qualify for Alberta’s health insurance and refugee claimants are not covered by Alberta’s health insurance plan; their basic health care is paid for by the federal government through the Interim Federal Health Program until they qualify for provincial coverage. In the other direction, it also leaves out children born in Canada to NPR parents because they are citizens and are counted as such.
9 The data on children comes from the Statistics Canada 2021 Census of Population Public Use Microdata File. Analysis is that of the authors and is available upon request.
10 The data for this calculation comes from the Canadian Institute for Health Information’s National Health Expenditure Trends 2025, which reports Alberta’s provincial government health spending per person by age for 2023, and from Statistics Canada Table 17-10-0158-01, which reports the number of NPRs in Alberta by age on July 1, 2023. Unlike the rest of this post, the calculation covers NPRs of all ages, not only those aged 25 to 54. Analysis is that of the authors and is available upon request. Technical details will be published in a forthcoming report.
What’s next
In this post I have looked at non-permanent residents: how many are working, in what jobs, what they pay in taxes, and which provincial programs they are able to use. In the next and final post, I will bring together the evidence from all three posts and set it against the four immigration questions on the October 19th referendum, looking at what the evidence can and cannot tell us about each one.
Bringing it All Together: What Does the Evidence Say About the Referendum Questions?
On October 19th, Albertans will vote in a non-binding referendum that includes four questions on immigration. The first asks whether the province should take more control over immigration in order to reduce it, prioritize economic migration and give Albertans first priority on new jobs. The other three ask whether there should be limits or fees on provincially-funded programs and services for non-permanent residents (NPRs).1
Over the last three posts, I have looked at evidence that bears on those questions, drawing on analysis of publicly-available data and information that will feature in a report I have written with the Muttart Foundation. In the first post, I found that Alberta has a fairly ordinary share of immigrants by national standards, a share that grew steadily over twenty years, while its NPR population grew very quickly after 2021 and has begun to come down. In the second, I found that landed immigrants in Alberta work at about the same rate and the same hours as other Albertans and bring more education, but are paid less, and that every group pays more in taxes than it gets back in cash transfers and health care. In the third, I found that most NPRs are working, that temporary foreign workers are often in occupations with the highest job vacancies, and that NPRs pay taxes under the same rules as everyone else but are shut out of most of the provincial supports meant for those most in need.
In this final post, I bring that evidence together and set it against each of the four questions. The purpose is not to tell anyone how to vote. It is to set out what the evidence shows about each question, and just as importantly, what it cannot tell us.
1 The full wording of all four questions is available from Elections Alberta at https://www.elections.ab.ca/elections/referendum/.
Referendum Question 1
The first question asks whether the Government of Alberta should take more control over immigration for three purposes: decreasing immigration to more sustainable levels, prioritizing economic migration, and giving Albertans first priority on new jobs. Each part rests on a different claim about immigration, so I take them one at a time.
“Decreasing immigration to more sustainable levels”
The first part assumes that immigration to Alberta is running above a sustainable level. The data in this series cannot say what a sustainable level is. That would depend on things such as housing and infrastructure, which I have not looked at. What the data can show is where Alberta’s recent population growth has come from, and the answer is two very different stories.
For landed immigrants, the story is one of steady growth. The share of Albertans aged 15 and over who are immigrants rose from about 17% in 2006 to 27% in 2025, which brought Alberta up from below to about the national average. The number of new immigrants arriving each year rose over most of that period and ran a little above trend for three years after the 2020 pandemic, but by 2025 it was back to roughly where it had been in 2019. In other words, there has been no dramatic increase in the number of new immigrants arriving in recent years.
The rapid growth was in NPRs. Alberta’s NPR population grew 3.6-fold after mid-2021, from a little over 80,000 people to about 292,000 in late 2025, although even at its peak Alberta’s share of NPRs stayed below the national share. It has since begun to come down, to about 279,000 in July 2026, and the federal government aims to reduce NPRs to 5% of Canada’s population by the end of 2027. So the rapid growth of recent years came from temporary residents rather than from permanent immigration, and it has already begun to reverse.
“Prioritizing economic migration”
The second part asks that economic migration be given priority. Canada’s immigration system already does this. Most permanent residents are admitted through economic programs that select people on their education, work experience and language ability, and in 2026, 63% of new permanent residents are planned to come through those programs. Alberta also runs its own economic stream, the Alberta Advantage Immigration Program, through which the province nominates people for permanent residence. The evidence in this series cannot say how much of Alberta’s immigration already comes through that program.
What these blog posts did show is what economic migration has brought Alberta. As I showed in my second post, landed immigrants aged 25 to 54 work at almost the same rate as other Albertans, and those who have been here more than ten years are slightly more likely to be working. They work the same forty-hour week. They also bring more education: immigrants make up 29% of core-age Albertans but hold 38% of the university degrees held by people that age. Where they differ is in pay and in the use of that education. Immigrants earn less per hour than other Albertans, even with a degree, and are less likely to be working in a job that requires the degree they hold. And every group, immigrant or not, pays more in taxes than it receives back in cash transfers and health care.
“Giving Albertans first priority on new employment opportunities”
The third part concerns who gets new jobs. If “Albertans” includes the permanent residents who live here, as it would in everyday use, then this part bears mainly on NPRs, and in particular on the temporary workers who come here on work permits.
For part of that group, a version of “Albertans first” already exists. Before an employer can hire someone through the Temporary Foreign Worker Program (TFWP), it must show that no Canadian citizen or permanent resident was available to do the job. As I showed in my third post, TFWP permits went largely to occupations with more job vacancies, such as cooks, food service workers, truck drivers and farm labourers, though many of those jobs are among the lowest paid in the province. What the data cannot answer is whether these jobs go unfilled because there are not enough workers or because residents will not take them at the wages offered.
The larger program, the International Mobility Program (IMP), has no such test. Most IMP permits are open permits, not tied to an employer or a job, many of them held by people who graduated from a Canadian college or university. So no occupation is recorded, and the data in this series cannot say what work IMP permit holders do or whether they are competing with other Albertans for it.
Referendum Questions 2 to 4
The other three questions all concern NPRs’ access to provincially-funded programs. Question 2 asks whether only citizens, permanent residents and people with an “Alberta-approved immigration status” should be eligible for programs such as health care, education and social services. Question 3 asks whether NPRs should have to live in Alberta for twelve months before qualifying for provincial social supports. Question 4 asks whether NPRs should pay a fee or premium for their and their family’s use of health care and schools.
The starting point for all three is what NPRs can already get, which I set out in my third post. Work and study permit holders are already not eligible for most of the provincial programs meant for those most in need, including Income Support, AISH and ADAP, the Child and Adult Health Benefit, disability supports, social housing and rent assistance. What they can use are the more universal programs: Alberta’s health insurance plan, if they meet its conditions, and schools for their children, along with the child care subsidy for work permit holders and Legal Aid.
For permit holders, then, Question 2 concerns mainly access to health care and schools, and who it would cover depends on what counts as an “Alberta-approved” status, which the question does not define.
Question 3’s waiting period would likewise change little for permit holders who are already excluded from most social supports, while some waiting conditions already apply where they do qualify: health insurance requires an intention to stay at least twelve months and a permit with at least six months left, and the Alberta Child and Family Benefit requires eighteen months in Canada. The group a waiting period would affect most is refugee claimants, who can currently receive Income Support and the Child and Adult Health Benefit.
Question 4 turns on what NPRs pay and what they cost. Most NPRs have a work permit and about three-quarters of NPRs ages 25 to 54 were employed in 2021. NPRs who work pay income tax and payroll premiums under the same rules as everyone else, and in 2020 they got back about the same in cash transfers for every dollar of tax as Canadians-by-birth, 29 cents against 27. The census cannot tell us what health care and schooling NPRs use, but the evidence points one way. Almost no NPRs are seniors, so if they used health care at the same rate as other Albertans their age, their care would cost about $3,700 per person against an average of about $5,900. Refugee claimants’ basic health care is already paid for by the federal government, not Alberta. And NPRs are less likely than Canadians-by-birth to have children living with them in Canada.
What the evidence cannot tell us
There are important questions these blog posts cannot answer. The first is whether immigrants or NPRs take jobs that other Albertans would otherwise have had. The data show who is working and in what kinds of jobs, and that temporary foreign workers are concentrated where employers report vacancies, but they cannot show what would have happened to those jobs, or to Albertans’ wages, without them. For the same reason, the series cannot say what would follow from reducing immigration or the number of NPRs, for the economy, for public finances or for the industries that rely on them.
The second is what NPRs actually use in public services. The health care figure I estimated in my third post is based on age alone, and the public-use census data does not record school-age children in a way that allows schooling to be costed. The fiscal figures in all three posts are also a snapshot of a single year, so they say nothing about what people will pay or receive over the rest of their lives, and they leave out other things government provides, such as post-secondary education, justice and roads.
Finally, much of the evidence on NPRs comes from the 2021 Census, when Alberta’s NPR population was less than a third of its size today and when work was still shaped by the pandemic. Today’s NPRs are a larger group, and a different mix, with more holders of open work permits under the IMP, so the 2021 picture may not hold for them. The 2026 Census will allow these numbers to be updated, but its results on income and immigration will not be released until well after the referendum.
Final Thoughts
The evidence in this series speaks to parts of each of the four questions, though not to all of them. Immigration to Alberta has grown steadily over twenty years, and the rapid growth of recent years came from NPRs, whose numbers have begun to come down. Immigrants and NPRs mostly work, pay taxes under the same rules as everyone else, and receive back less than they pay in cash transfers, and NPRs on permits are already excluded from most of the provincial supports meant for those most in need.
This series has also not looked at housing shortages or crowding in health care and schools, which are often linked to immigration in public debate. It is worth remembering, though, that how much pressure population growth puts on services depends on more than the number of people. It also depends on how much capacity governments build: health care and schools are run by the province, and the supply of housing depends on decisions by all three levels of government.
Beyond the evidence, the questions also ask Albertans to make judgements that data cannot make for them: about how many people the province should welcome, on what terms, what it owes to those who come here to work or study for a time, and whether those decisions should be made by the province or by the federal government.
My hope is that these posts help Albertans make those judgements with the facts in hand.